1:
|
Metric Filter. With this tool you can enter complex filter statements that specify how a given filter field should be compared to a specified filter criterion. The filter uses the following syntax:
<filter field> <comparison operator> <filter criterion>.
Some examples of possible filter strings include:
Vehicle[Year]=2015 - This filters the data to include only vehicles registered in 2015.
Vehicle[Fuel Type]=Gasoline - This filters the data to include only vehicles that use gasoline, and exclude vehicles running any other fuel type (for example, diesel).
You can also combine filters using this tool, to focus your report on specific metric combinations. For example, to filter all trips for a specific vehicle (Truck) after and including a set date (2010) you could combine two filters:
Vehicle[Name]=Truck
Start Time[UTC Year]>=2010
To create a filter, click the Metric Filter control located in the upper right corner of the screen. The filter wizard opens:
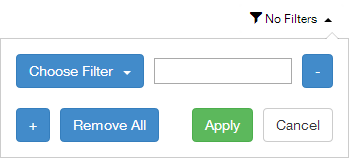
Click Choose Filter, then click successive attribute option links to navigate to an individual filter field. These are the fields the filter should be applied to:
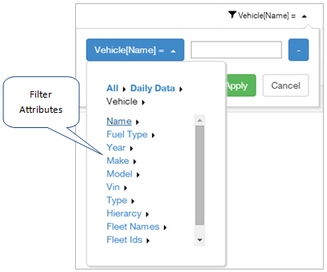
You can specify filters for any of the following:
| • | Vehicle - Contains a variety of vehicle attributes, including manufacturer, year, model, fleets, and tags. |
| • | Day - Time periods used to filter data displayed, in addition to the date filter. |
Select an attribute from the Vehicle filter:
| o | Vehicle Name - The name of the vehicle. |
| o | Fuel Type - The type of fuel used by the vehicle, for example, diesel or gasoline. |
| o | Year - The year of registration. |
| o | Make - The manufacturer of the vehicle, for example, "Ford" or "Volvo". |
| o | Model - The model of the vehicle, for example, "F250". |
| o | VIN - The unique Vehicle Identification Number assigned to the vehicle. |
| o | Color - The color of the vehicle. |
| o | Registration - The registration (license plate) details of the vehicle. |
| o | Vehicle Type - The type of vehicle, for example, "Crane". |
| o | Engine Serial Number - The unique serial number of the vehicle's engine. |
| o | Hierarchy List - The hierarchy that contains the vehicle. |
| o | Hierarchy IDs - The unique ID of the hierarchies that contain the vehicle. |
| o | Is Unit Active - The vehicle's active/inactive status in the fleet. |
| o | Fleet Names - The name of the fleet the vehicle is assigned to. |
| o | Fleet IDs - The ID value of the fleet the vehicle is assigned to. |
| o | Tags - The arbitrary tags assigned to the vehicle, for example, "Joe's Truck" or "Weekend Only". |
| o | Base - The marker location where the vehicle is based. |
Next, choose a comparison operator for Vehicle filters, or a date operator for Day time filters. For vehicles, this operator determines how the field value should be compared to the filter criterion. Possible comparison operators include:
| o | Equals: "=" this filters the graphs to show all events and values where the filter criterion exactly matches the filter field's value. |
| o | Not Equals: "<>" - this filters the graphs to show all events and values where the filter criterion does not match any part of the filter field's value. |
| o | Like - this filters the graphs to show all events and values where the filter criterion partially matches any part of the filter field's value. |
| o | Not Like - this filters the graphs to show all events and values where no part of the filter criterion matches any part of the filter field's value. |
| o | Is Default Value. Selects only items that match the default value for the metric. No filter criterion is required. |
| o | Is Not Default Value. Selects only items that do not match the default value for the metric. No filter criterion is required. |
For date-based filters (Day and not including Vehicle Year) you are instead required to filter on one of the following pre-defined date value comparison operators:
| o | Equals: "=" this filters the graphs to show all events and values where the filter criterion exactly matches the filter field's value. |
| o | Not Equals: "<>" - this filters the graphs to show all events and values where the filter criterion does not match any part of the filter field's value. |
| o | Comparison: greater than ">", or greater than or equal to ">=" or less than "<" or less than or equal to "<=" - these filter graph data so only events and values with the specified relationship between filter field and filter criterion are shown. |
| o | Is Default Value. Selects only items that match the default value for the metric. No filter criterion is required. |
| o | Is Not Default Value. Selects only items that do not match the default value for the metric. No filter criterion is required. |
For example: Week Starting Date<>1 (this equates to "Week start time is not January 1st")
Next, choose a filter criterion. This is a literal value that the filter field's value is compared to. Filter criteria are either strings or numbers for both Vehicle and Day filters.
| o | Numeric values can include any of the digits from 0 to 9, the "-" character, and a decimal point. For example, -3.14. |
| o | String values can include any alphanumeric values, plus the characters "-", ":", ",", " -", and ";". You can also include a dot (".") or space (" "), as long as the entire filter criterion is enclosed in quotes. For example: 'Tractor Trailer 12' |
To create more advanced filters, click Add  as many times as needed, each time adding an additional filter field, comparison operator, and filter criterion. Each additional filter is treated as an & (AND) statement in the final generated filter. To remove any component of these advanced filters, click Delete as many times as needed, each time adding an additional filter field, comparison operator, and filter criterion. Each additional filter is treated as an & (AND) statement in the final generated filter. To remove any component of these advanced filters, click Delete  beside the line you no longer want. beside the line you no longer want.
When you have selected all items to filter on, click Apply  . The graphs update automatically. Depending on the number of filters you have applied, this generation process might take a minute or so. . The graphs update automatically. Depending on the number of filters you have applied, this generation process might take a minute or so.
To clear all filter queries from the wizard, click Remove All  . .
To close the wizard click Cancel  . .
|


 Previous
 Next
Next Expand/Collapse
 Print
Print Share Page
 Training
 Knowledge
