Tableau Desktop is a data visualization tool with a simple user interface that can be used to explore analytics server databases. Tableau can be used to present retrieved data in a wide variety of graphical formats, including bar, pie and Gantt charts, heat maps and line graphs. A fully functional 14-day trial version of this application is available for download from http://www.tableau.com/products/trial.
To connect to the analytics server with Tableau, follow the steps below.
To connect to the SQL Connector using Tableau, you must have the PostgreSQL ODBC driver installed. Follow these steps to install this driver:
If you have previously installed the PostgreSQL ODBC driver, skip to the Configuring Tableau section.
•
Download the required driver installer from http://www.tableau.com/support/drivers. Select either PostgreSQL (32-bit) or PostgreSQL (64-bit) according to the Tableau version you are using. Note that if you are using the 64-bit version of Tableau, PostgreSQL connections can use either the 32-bit or 64-bit PostgreSQL drivers. If you have both drivers installed, PostgreSQL will default to the 32-bit version.
•
Run the psqlodbc.msi or psqlodbc_x64.msi installer file to begin the installation process.
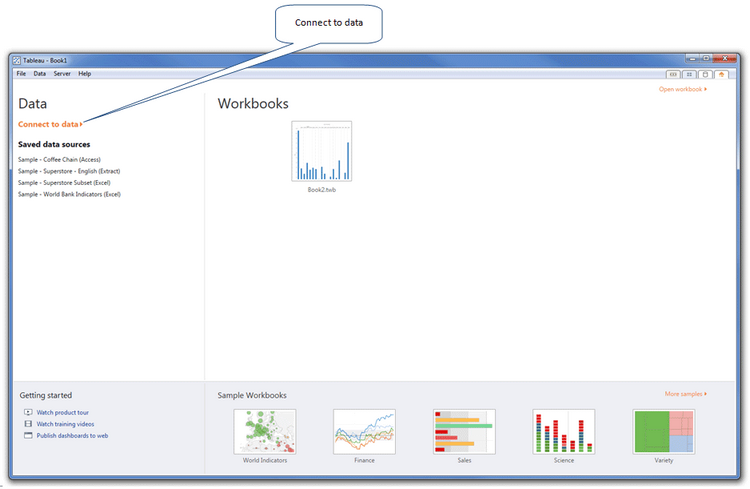
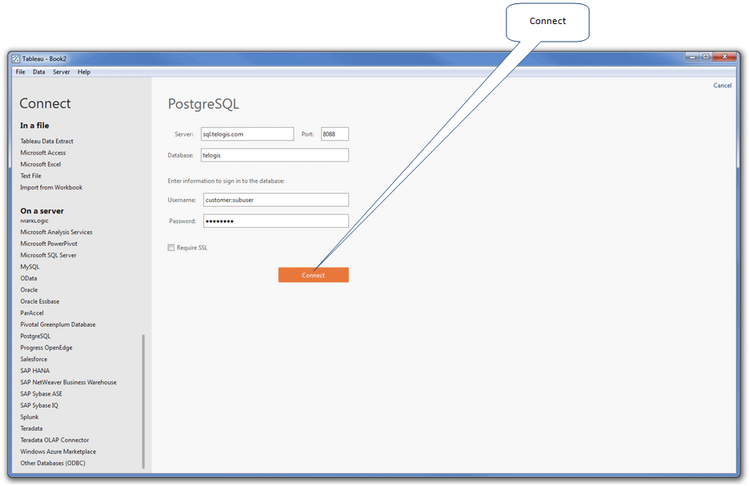
Click Connect to data from the left-hand menu. The Connect screen opens.
•
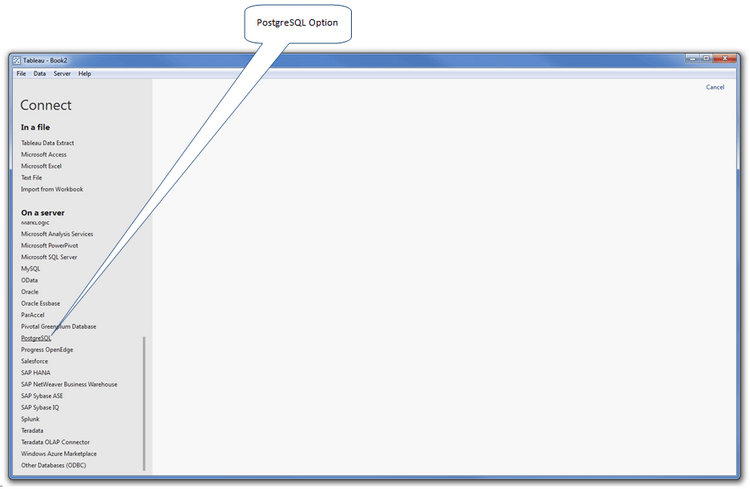
Click the PostgresSQL option under the On a server section of the left-hand menu. The PostgresSQL configuration screen opens.
•
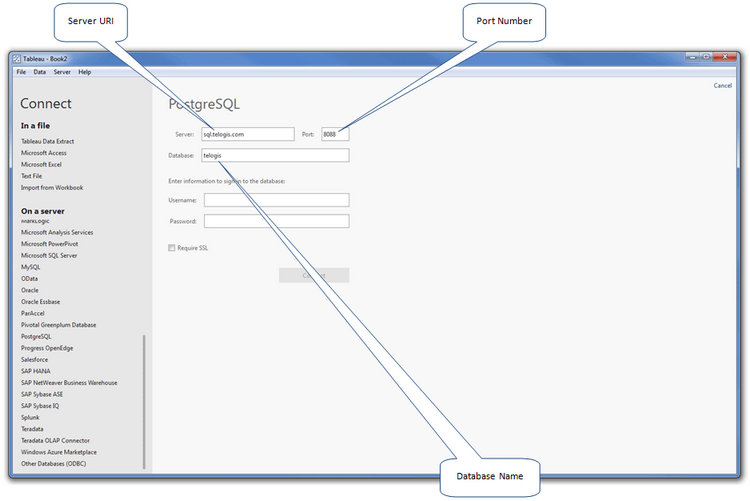
Type 'sql.telogis.com' into the Server field,'8088' into the Port field, and a suitable database name into the Database field. In the example below we have named the database 'Verizon Connect'.
•
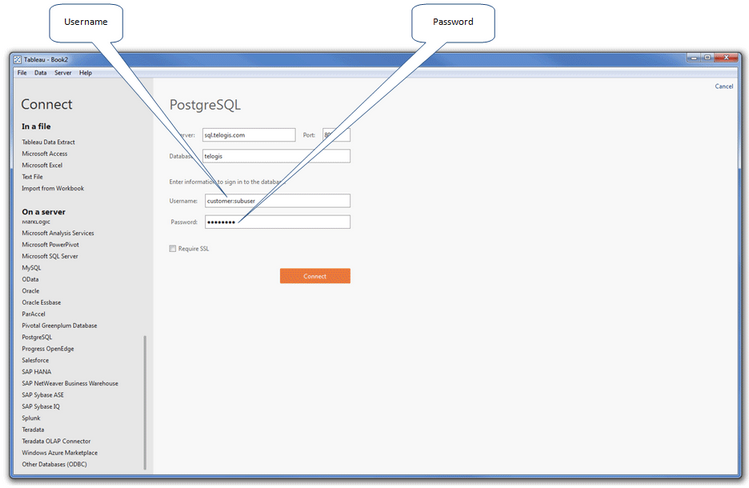
Type the username and password provided to you into the Username and Password fields. If you have not been provided with suitable credentials, request these from your Verizon Connect administrator.
•
Click the Connect button. The database connection will be established, and the database opened in the Table Selection screen.
•
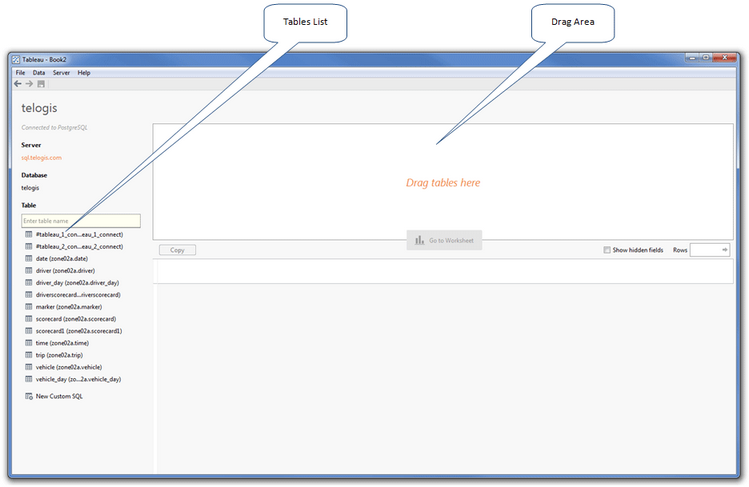
Drag a table, or tables, from the Table list on the bottom left-hand corner of the screen into the Drag tables here area. Selecting the trip table is a good place to start.
•
Click the Go to Worksheet button. The worksheet for the selected table(s) will open.
•
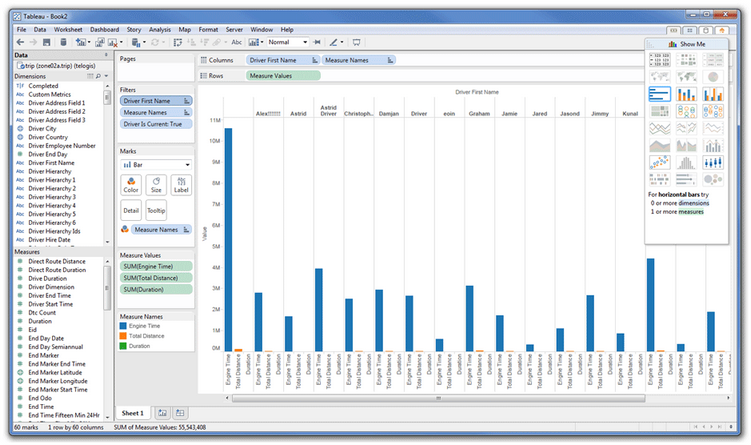
Drag your required table data from the Dimensions and Measures lists on the left into the Filters, Columns and Rows areas to begin analyzing data. Use the floating Show Me panel to select various graphical presentation types, such as line charts and scatter plots. The example below shows a bar graph based on the driver’s name, engine running time and the total distance they drove:
 Previous
 Next
Next Expand/Collapse
 Print
Print Share Page
 Training
 Knowledge